|
BRITISH ARTILLERY IN WORLD WAR 2 |
|
ERRORS AND MISTAKES |
|
Updated 6 June 2014 |
|
|
|
|
|
|
|
|
|
|
|
|
|
|
|
|
|
|
|
|
|
|
|
|
|
|
|
|
|
|
|
|
| AFTER WORLD WAR 2 |
It can't be avoided, the Gunners have sometimes been called 'drop shorts' because the shells didn't land where they were expected. Sometimes, despite all the checks, this really was the result of a mistake. More usually it’s the result of natural variability in the system - errors. In World War 1 (WW1) educating the infantry about errors was an important activity. Errors are a natural consequence of the variability of outcomes for repeated 'identical' events. It's a branch of statistics called probability theory, although this may not give much comfort to anyone unfortunate enough to be in the way. Of course it's equally likely that shells went too far as fell short.
It appears that the British (in collaboration with the Canadians) were the only army to undertake detailed studies into errors and mistakes in the 'wash-up' after World War 2 (WW2). The task was undertaken by the Field Artillery Working Group of the Standing Committee on the Accuracy of Artillery Fire (FAWG of SCARF). The reason for this work, undertaken by several sub-committees, was concern that predicted fire had been inaccurate, perhaps as few as 7% of predicted engagements being sufficiently accurate. The committee used many sources including reports by 1st (Italy) and 2nd (21st Army Group) Operational Research Sections, data collected in various trials and tests in UK and Canada, including specially commissioned ones, those undertaken by field army formations notably 1st Canadian Army, and studies and trials undertaken by the Ordnance Board and published in their Proceedings. The role of 1st Canadian Army is unsurprising, its commander General AGL McNaughton, was an artillery officer with immense technical knowledge and understanding who had been the counter-bombardment officer in 1st Canadian Corps in WW1.
The result of this research was a sustained effort over the next half century to reduce the sources of error, this was highly successful. The detail of this is given in the pages in the Fire Control section of this site.
It's highly unlikely that all the various errors and mistakes were a uniquely British phenomena, and many applied to the artillery of all nations, although mistakes are likely to increase in a poorly developed artillery system, one where insufficient double-checks occur.
The first point to remember is that inaccuracy is only a problem with map-shooting. If fire is ranged then the observer adjusts the fall of shot until the mean point of impact of the fire unit is on or close to the centre of the target area as the observer sees it - the guns are used as a 'rangefinder'. However, the guns' sights could only be set in increments of 25 yards for range and 5 minutes for line (about 15 yards at 10,000 yards. There was a precision ranging technique used with a single gun against a point target, but it could be time consuming and in the end relied on the law of probability to achieve direct hits.
Key definitions are:
This page concentrates on errors, but it may be noted that mistakes are not limited to artillery, infantry wrongly or not reporting their current position or not passing it to artillery can result in their being in the wrong place at the wrong time. The main problem was map shooting, using ranged fire meant that an observer was watching the fall of shot and its vicinity, and could quickly stop or move the fire if they safety of friendly forces was at unacceptable risk.
Errors are in one of two categories - accuracy or consistency. Accuracy means the closeness of the mean outcome to where it should be. For example the difference between the mean point of impact (MPI) of fall of shot and their aim point. Consistency means the size of the spread of outcomes (eg shells) around their MPI. In artillery this variability is called 'consistency' or 'dispersion' (the optimistic or pessimistic views of the world - do you call a glass half-full or half-empty?), elsewhere it is sometimes called 'precision'. Nevertheless in practical terms sources of inaccuracy may include mistakes as well as errors and in some cases the division is a fine one and routine human mistakes may be treated as errors.
For artillery fire there are two main components to accuracy, how close the aimpoint is to the actual target (sometimes called the 'target location error') and then how close the fire unit's shells' MPI is to their aimpoint. The first is a function of the accuracy and consistency of the target acquisition system and how accurate the target coordinates are, not just horizontally but also altitude because an error in altitude causes a horizontal error in fall of shot. The accuracy and consistency of the second is mostly a function of the data and methods used to 'fix' and orient (ie survey) the guns and to calculate their firing data. The purpose of ranging is to correct for these sources of inaccuracy. However, inaccuracy also arose from day to day variations from the calibrated muzzle velocity.
Figure 1 illustrates the concept in terms of the fall of shot around an aimpoint. Of course the apparent irregularity really reflects the small size of the sample.
Figure 1 - Accuracy & Consistency
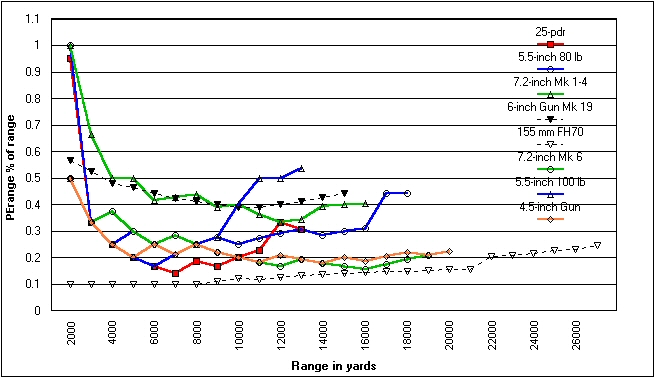
The main driver of consistency is the extent of the round to round variation in muzzle velocity (MV), and this is mostly a function of the ammunition, both shell and propellant, and its design, manufacture and handling. The tightness of quality control in keeping it to its specifications (eg propellant energy, shell weight and shape) is a major factor. Other sources of variation are due to differences in ammunition storage and handling at the gun and how firmly the shell is rammed. Unpacked ammunition that has been sitting in the sun will perform slightly differently to that taken directly from its packaging. Nevertheless there are differences in the probable errors in the range or firing tables for different guns firing the same ammunition, look at the two 7.2 inch in Figure 4 below, and consider the different carriage stability characteristics in the gun data sheet. Of course in some cases this may reflect differences in national measuring and calculating methods. Consistency also deteriorates when a gun is well worn because barrel wear makes the shell less stable in flight.
Round to round variations also occur due to very small inconsistencies in laying causing the gun to be pointed in fractionally different directions for each round. To this can be added very small variations due to the continuously changing atmospheric conditions that affect the shells' flight, and shells at transonic speed are notably less consistent than those above or below this speed. There are also small variations in gun specific characteristics such as jump and droop. Finally there are residual factors that are not properly understood, see the Calibration page.
The main sources of lack of accuracy are mostly not an inherent characteristic of a gun, Tables 1 and 2 later on this page show this. Only two sources of any size might the considered gun dependent, and they are dwarfed by others. The first of these is the graduation of sights, and this is basically the same for all guns, the basic unit of measurement, 5 minutes in UK, had specific distance on the ground depending on range, charge and the type of gun. There are also day to day variations and although these are about their mean, they can cause inaccuracy on an occasion to occasion basis. The most significant is again muzzle velocity, and trials demonstrated a day to day correlation between guns in a troop, ie the group of guns tended to be effected the same way each day. Apart from these it is really a matter of the quality of data in range tables, the quality of data about current non-standard conditions (meteor and propellant temperature, plus muzzle velocity) and the accuracy of the methods used to combine these to produce firing data. Not forgetting the entirely external sources of survey accuracy and target location error.
Of course to an observer there may be a perception of gun accuracy but this is probably a mixture of consistency and occasion to occasion error. Assuming an accurately located target and predicted fire then a single round from a consistent gun will usually appear more accurate than one from a less consistent gun because it will probably be closer to the target. However, the mean of several shells could be correct in both cases.
Both accuracy and consistency are measured in terms of 'Probable Errors' (PE) and exist throughout the artillery system. For example the MPI of the fall of shot from a single gun may or may not be at its aimpoint. The distance MPI to aimpoint is accuracy, the size of the fall of shot's spread around its MPI is its consistency. Similarly the MPI of the MPIs of each gun in a battery will be the battery MPI, and the MPI of the MPIs of the batteries in a regiment will give a regimental MPI (assuming they were all aimed at the same point). The measure of how far these MPIs are from their common aimpoint is their accuracy and is also defined in terms of PEs.
Conventional statistics defines variability in terms of 'standard deviations' from the mean with a 'normal distribution' (a 'bell curve'), such that all outcomes for a particular type of event will fall within about three standard deviations from the mean of them. Artillery does not use standard deviations, but 'probable errors' (PEs). In essence its just a matter of slicing up the spread of outcomes in a different way. Instead of them all falling within 6 standard deviations of the mean (3 either side) they fall within 8 PEs, 4 either side of the mean, the total distance is the same. Figure 2 shows the normal proportional distribution of outcomes for an event. The 2 PEs (one either side of the MPI) are called the 50% zone, because 50% of the shells fall there, the central 4 PEs give the 82% zone, and so on. Obviously within each zone there will be a gradient, with more shells towards the MPI side than the outer side. The size of a PE will vary but their distribution does not, Figure 2 shows the distribution of PEs as a histogram, the horizontal axis represents the size of a PE. A small number of shells, about 1 per 500, fall outside the 100% zone.
Figure 2 - Standard Distribution of Probable Errors
Dispersion about the Mean Point of Impact
For example the spread of the fall of shot from an individual gun firing repeated shells at the same data, the size of these PEs are documented in Range Tables. For a 25-pdr firing charge 3 at 8000 yds range the PER was 30 yds (PE range - along the line of fire) and PEL was 4 yds (PE line - across the line of fire). Figure 3 illustrates the distribution of 100 shells when combining their range and line PE, (rounded numbers). Of course it's also possible, but unlikely, for a shell to fall at the extreme of both range and line PEs. Most properly conducted actions in the artillery system (eg plotting on an artillery board, the target location, laying) have a normal distribution of errors, some of them circular.
Figure 3 - Range and Line PEs Combined
For fall of shot from an individual gun It must, of course be remembered that the PEL is much smaller than the PER, this means that in distance terms 50% of the rounds will fall within one PER of the target.
Figure 4 shows British WW2 guns and their dispersion PER as a percentage of range. For comparison a WW1 gun (6-inch Gun Mk 19) and 1960's design (155-mm L121 (FH70)) are also shown. The PEs, taken from Range Tables, are for the propelling charge with the smallest PE at each range. However, British WW2 Range Tables only gave PER to the nearest 5 yards, which probably explains the slightly erratic data.
Figure 4 - PER as a Percentage of Range for British Guns
For some variables the PE could be circular around the mean (PEC), with 1 PEC (or CEP) all round being the 50% zone. PE for different things can be added together using the 'root mean square' rule (square the PEs, add them together and find the square root). This reflects the reality that errors on the same axis partially cancel each other out.
However, this is only valid if all the errors are in the same dimension. The disparity in the size of PEL and PER, which are in different dimensions (axes), means that combining them to give a CEP is misleading because the two axes give an elliptical not circular shape (Figure 3 above). Where two dimensions are equal size then the CEP is 1.75 × PE. Where they are reasonably close, say PER25m and PEL20m, then the square root of the average of their squares is a reasonable approximation, 32m CEP in this case. However, when they are far apart, eg PER25m and PEL5m, this method gives 18m CEP (or 21 yards CEP in the 25-pdr example above), a useful 'improvement' in PER but clearly an impossibility. Nevertheless, CEPs do appear in manufacturers' brochures and are quoted, and sometimes manufacturers add another layer of obfuscation by presenting this CEP as a percentage of range!
MISTAKES AND ERRORS IN WORLD WAR 2
In September 1945 FAWG of SCARF produced the 'Final Report of the Committee Set Up to Investigate the Accuracy of Predicted Fire'. The committee was established by the joint direction of the Director Royal Artillery and the MGRA Training. It's noteworthy that the DRA had also been the originator of Operational Research in the British Army. The work was undertaken by several sub-committees with representatives from a wide range of military organisations.
The main sources of mistakes were identified as:
People are prone to make mistakes, particularly when under stress or severe environmental conditions (you try doing things in the dark, in driving rain at near freezing temperatures when you're dog tired and someone's shooting at you). The system of drills and double checks was designed to eliminate mistakes. For example the data was set on the sights by the layer and the charge was prepared by the loader, with both being checked by the Number 1 (gun detachment commander). However, while the official reduced detachment for a 25-pdr was 4 men, in the field 3 men were often used because this gave 'half on, half off' with the 6 man detachment. The result was that the Number 1 acted as loader while doing his other Number 1's duties, but there was nobody to double check his preparation of the charge (apart from the rammer, but since the 3 man reduced detachment wasn't 'official', it wasn't his official duty), and the Number 1 may have been a bit coy about reporting any 'bad ram'.
Mistakes could also lead to errors. If shells were loaded with dirt on their driving bands then after a few hundred such rounds there was measurable ovality in the barrel, which caused increased error. An observer mis-locating a target can be regarded as a mistake. However, since it is pervasive it can be treated as an error and hence subject to statistics. In WW2 an additional source of target location error was the inaccuracy of maps in many places.
Of course mistakes also happened outside artillery control. Most notably when infantry were in the wrong place at the wrong time. For example they failed to stop at a phase line denoting the safe distance to the opening rounds of the next phase of a fireplan or made a mistake in reporting their position. In reality this type of infantry mistake was probably the real cause of many reports of rounds 'falling short', although artillery Forward Observers have a key role in ensuring reports of infantry whereabouts are up to date.
PEs occur throughout the artillery system. Table 1 shows the size of the PEs that affect accuracy in range for predicted fire, line errors, Table 2, were generally small. The FAWG of SCARF report goes into considerable detail to explain all the factors, including when they could be larger or smaller. It may be noted that Range Tables give PEs of 35 yds and 55 yds for 25-pdr and 5.5-inch respectively at the ranges used. The selected ranges and charges have an elevation of about 25 degrees.
The first source of inaccuracy is the target location, maps were often inaccurate and it is not always easy to determine accurately (within 10 yards) the coordinates of a target some distance away. It is also essential to have accurate fixation and orientation for the guns (a survey matter). Other issues include the precision of the sights (eg 25 yards and 5 minutes) and of the firing data calculations, and the accuracy of the data used in the calculations. The biggest problems with the latter are the muzzle velocity and the meteor data, but the range tables also need to be accurate.
For readers unfamiliar with the measurements used:
1 inch
= 25.4 mm
1 foot = 0.3048 metres
1 yard = 0.9144 metres
1 minute =
0.296 NATO mils (6400 to a circle)
1 degree = 17.78 NATO mils
1° Fahrenheit
= 1.8° Celsius
TABLE 1
Errors which affect the range to the MPI in predicted fire (map shooting)
TABLE 2
Errors which affect accuracy in line
Note that as a horizontal angle 1 min subtends about 1 ft at 1000 yds, therefore at 9000 yds range 2 min = 6 yds, and that in these tables 'v' signifies square root.
The size of the errors in serials 8 to 22 in range (Table 1) and 6 to 11 in line (Table 2) increase with the range between gun and target, in some cases it is a function of range in others it is more closely related to time of flight. In Table 1 serials 3 and 4 originate outside the gun position and are sometimes called the 'target location error'. Putting the range and line errors together helps identify the main problem areas.
The most significant were errors in correction of the moment (C of M) for non-standard conditions, the main source was that the meteorological data could be used several hours after being measured. Wind is the main variable because this can change quickly and significantly. However, wind was the only meteor variable actually measured at different altitudes. The other variables, used to determine air resistance (temperature and humidity), were measured at ground level and tables used to estimate actual values for the different trajectory altitudes. Furthermore, when a large correction was ordered to move the fall of shot it was not adjusted for a different C of M correction. Varying propellant temperature from various ways of storing ammunition on gun positions was also significant (TV news films show that this remains a problem in many 'armies'!). Finally the interpretation of air burst ranging results was also a source of error.
Next were those errors associated with target location, interesting because they show height as a bigger problem than location. The reason for this was that predicted targets tended to be acquired from locating systems such as sound ranging and flash spotting or gridded air photos that were reasonable accurate. However, the locations then had to be plotted on a map to find the target height. The problem then was the inaccuracy of the maps, particularly in France where a well marked feature such as a road junction could be mis-positioned by up to 100 metres. This meant that height was often wrong because it had been taken from the wrong place on the ground. Obviously these problems with maps meant that predicted targets selected by ground observers were also inaccurate, exacerbated by the much greater PEs for target locations by Forward Observation Officers (some trials revealed a PE of over 100 yds by FOOs, even with good maps). The source of the mapping problem was the difficulty in getting accurate maps at the British Army's standard scales for enemy or occupied territory.
Plotting was based on the use of 1:25,000 scale plots used on artillery boards in command posts, however, long range guns were plotted at 1:50,000 and this doubled the PE. The underlying causes were the inability to plot to greater than 10 yd precision on a 1:25,000 grid and bowing in the board's steel range arms from rough handling.
Variation in propellant from type to type and lot to lot. Different propellant types were available for most types of gun, eg FNH, NQ, WM, etc, these types were matched in cartridges for new gun MVs. However, worn guns behaved differently in terms of MV equivalence. Lots were manufacturing batches, with manufacture in factories around the world. Just as light bulbs have different length lives due to manufacturing variability so is there variability in the manufacture of propellant lots, and British lots were relatively small so there were many different ones in the supply chain and reaching gun positions. See the 'Ammunition' page for more information about propellant.
Calibration results, particularly applying the calibration correction for one charge to others, this saved a lot of time in calibration firing, but at the price of MV accuracy. This comparative calibration method was less accurate than full calibration of individual guns, a more time consuming business. It's a classic case of being able to trade speed for accuracy, a feature of the British artillery system and its flexibility. Generally, calibration in the field was by observing fall of shot although instrumental calibration at the muzzle was used on some practice ranges. However, as guns wore the MV found by the two methods diverged because instrumental calibration didn't take account of loss of ballistic co-efficient, resulting from increased wear causing loss of in-flight stability and hence less range. Updates to MV were also calculated from wear measurements and more approximately from EFCs.
Slow wearing guns such as 25-pdr weren't too much of a problem but fast wearing ones such as 5.5-inch, 4.5-inch and 155-mm M1 were. Research in 2000 using new precision instruments (micron measuring) revealed that it is wear to the grooves not the lands that causes most loss of MV. There was no fixed barrel life or condemnation limits and Range Tables gave the relationships of MV, EFC and measured wear up to about 2 - 4% of calibre. However, there seems little doubt that worn barrels were not being replaced early enough. The following table gives an indication of the rate and effects of wear, which was always measured one inch from the commencement of rifling. More detail about the different propellants is on the 'Ammunition' page.
Table 3 - Wear, EFC and MV
| 25-pdr |
5.5-inch 80lb shell |
||||||
|
|
EFC Values |
MV Loss |
|
EFC Values |
MV Loss |
||
| Propellant Type |
Ft per second per 0.010-inch |
Propellant Type |
Ft per second per 0.010-inch |
||||
| Charge |
W, WM |
N, NQ, AN |
Charge |
WM |
N, NQ |
||
|
1 |
0.12 |
0.06 |
-5 |
1 |
0.04 |
0.02 |
WM -6.5 NQ - 3.5 |
|
2 |
0.12 |
0.06 |
-6 |
2 |
0.04 |
0.02 |
WM -4.5 NQ - 2.5 |
|
3 |
1 |
0.5 |
-10 |
3 |
0.25 |
0.12 |
WM -8.5 NQ - 7 |
|
Super |
4 |
2 |
-20 |
4 |
1 |
0.5 |
-6.5 |
|
|
Super |
2 |
0.5 |
WM -7 NQ -6 |
|||
| Each 0.010-inch of wear approx 1700 EFC |
Each 0.010-inch of wear approx 200 EFC |
||||||
The last significant problem was day to day variation in gun performance, and again 155-mm M1 was particularly notable in this respect. The causes of this variation are not well understood to this day.
From the above tables for predicted fire some key points emerge, assuming no mistakes. For 25-pdr at a range of 9,500 yds:
Of course there will be a tendency for the MPIs to be skewed away from and not 'around' the target because some errors, such as target location, common survey grid and meteorological data, affect all fire units in much the same way.
Air-burst shells, with clockwork or powder burning fuzes were a further problem. It was virtually impossible to get the optimal height of burst (HOB) for HE (about 30 feet) by prediction, although a 'good enough' result for higher bursting shells such as smoke was usual. Even with ranging the HOB for air-burst fuzes was normally distributed so that from a battery there would be some very low 'daisy cutters' or ground-burst and some at 60 feet or more, and ranging HOB for regimental or higher targets usually meant ranging each battery's HOB in turn. The great advantage of VT fuzes when they were released for field use was their accurate and consistent HOB.
The next table gives data for errors that change the consistency of the fall of shot from a single gun. It applies to both predicted and observed fire. The values are for a multiplier to the Range Table 50% zone (2 × PE), 70 yds for 25-pdr.
Table 4 - Errors which affect dispersion in predicted and observed fire
This table clearly shows that the main cause of increased dispersion was worn guns, and that some data was unavailable (serials 5, 9 and 10). Serial 6 relates to an engagement lasting about 1 hr and the meteorological conditions changing during that period. Data for dispersion in line shows this to be small, totaling about 3 mins. An underlying cause of range tables giving smaller PEs than found in the field is that the data for range tables was collected during range and accuracy firings. These were undertaken with all possible measures to eliminate variability between rounds.
Applying these multipliers to a 25-pdr 50% range zone of 70 yds, gives 84 yds for new guns and single lots to 126 yds for old guns and mixed lots.
DISPERSION COMPENSATING FOR INACCURACY
Dispersion can compensate for inaccuracy. Figure 5 shows a illustrative relationship between an actual target on the ground, its location as ordered by the originator (the aimpoint, offset from the target by the target location error) and the fall of shot from a regiment of three batteries each with their own MPI, only one shell from each gun is represented. There is some effect on the target, and there would be more when the dispersion for the fall of shot of each gun is added (see Figure 3), furthermore the spread of fragments from each bursting shell is laterally from the line of fire and forward (see the 'Effects and Weight of Fire' page). Of course each troop has a different line of fire, how different depends on how the regiment is spread out.
Figure 5 - Illustrative relationship between target, aimpoint and fire unit MPIs
Note that the guns' individual aimpoints are not necessarily the battery's. A British battery was divided into two troops, usually a few hundred yards apart. Each aimed their pivot gun at the battery's aimpoint with the other guns parallel to them and firing at the same range. This gave a natural spread to a battery's fall of shot relative to its battery's aimpoint.
The FAWG of SCARF report investigated the issues of accuracy and dispersion for different numbers of fire units. In essence the question was "will employing 18 troops instead of one give 18 times the density of fire over the same area, or the same density over 18 times the area, or something in between". The following Table 5 refers back to Table 1 above and refers to 5.5-inch guns firing 100-lb shells with charge 4 at 13,000 yds. Of course there was almost certainly never an AGRA of 4 regiments all with 5.5-inch!
Table 5 - Errors which affect accuracy and dispersion in range in a concentration
The data assumes an AGRA was deployed on a 6,000 yd frontage, so for 9,000 yds range the angles between the extreme lines of fire were 9 degrees for a regiment and 26 degrees for the AGRA. This affects the direction of the error in wind corrections as well as the overall pattern of the fall of shot.
Table 6 - Errors which affect accuracy and dispersion in line in a concentration
The results from Tables 5 and 6 are combined in Table 7. Table 7 shows that as the number of guns increase the accuracy of the concentration improves and the dispersion of MPIs from individual guns and their fall of shot around the overall MPI increases.
Table 7 - Summary of PEs for range and line in concentration of fire
Table 8 provides multipliers that can be used with Range Table data to give a reasonable approximation of the area covered by different numbers of guns and the density of fire. The area covered by fire is approximately proportional to the square root of the number of guns firing. The density of fire is proportional to the ratio of the square root of the number of gun and the area covered by fire.
Table 8 - Estimate of increase in area covered and density of fire arising from increase in number of guns

Tables 5 - 8 show results that accord with common sense. For accuracy the more fire units there are the closer the MPI is to their common aimpoint, overall accuracy improves. However, the consistency of individual guns' MPIs reduces.
Reducing the error budget became a sustained goal. The most immediate task was improving the accuracy of command post methods. These are described on the Fire Control 1945-69 page, computers were introduced in 1970, see the The Computer Age page, and this gave a step-change in the precision, accuracy and consistency of calculations. Associated with this were improvements in data before computers were introduced, see the Ballistics page. Survey was improved by the introduction of PIM for determining azimuth in the mid 1960's, and PADS for total survey 15 years later, see the Maps and Survey page The Global Positioning System subsequently gave very precise fixation. Meteor data collection also improved in accuracy, most notably by the introduction of sondes, see the Meteor page. These were hung from a radar tracked balloon to capture temperature and pressure data's they ascended through the atmosphere as well as providing wind data. Most importantly the introduction of small Doppler radars enabled a muzzle velocity measuring device to be fitted to every gun and measure every round to ensure MV was up to date and reflect day to day variations, see the Calibration page. Finally electronic sights were introduced in the early 1990's with AS90 and 2002 with Light Gun gave precision orientation and accurate and consistent laying, see the Sights and Laying page. The result was that by 2003 the MPI was extremely close to the aimpoint and, as Figure 4 shows, consistency had also improved significantly since WW2.
Copyright © 2001 - 2014 Nigel F Evans. All Rights Reserved.